Image Details
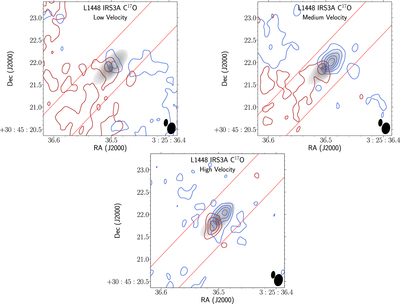
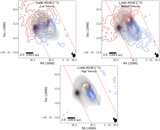
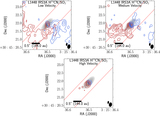
Caption: Figure 5.
C17O integrated intensity maps toward IRS3A over a selected range of velocities overlaid on continuum (gray scale). The C17O emission exhibits a velocity gradient across the continuum emission. However, the signal-to-noise ratio (S/N) is low in comparison with IRS3B. The panels correspond to low-, medium-, and high-velocity ranges. The following panel descriptions will be noted red (blue), corresponding to the Doppler shifted emission. The red lines indicate the region extracted for PV diagram construction, along the position angle of the major axis. Low velocity: velocity ranges 5.2 ﹩\to ﹩ 6.5 km s−1 (4.1 ﹩\to ﹩ 5.2 km s−1), contours start at 3σ (3σ) and iterate by 3σ (3σ) with the 1σ level starting at 0.0023 (0.0025) Jy beam−1 for the red (blue) channels, respectively. Medium velocity: velocity ranges 6.5 ﹩\to ﹩ 7.4 km s−1 (3.0 ﹩\to ﹩ 4.1 km s−1), contours start at 3σ (3σ) and iterate by 3σ (3σ) with the 1σ level starting at 0.002 (0.0016) Jy beam−1 for the red (blue) channels, respectively. High velocity: velocity ranges 7.4 ﹩\to ﹩ 8.6 km s−1 (1.8 ﹩\to ﹩ 3.0 km s−1), contours start at 3σ (3σ) and iterate by 3σ (3σ) with the 1σ level starting at 0.0018 (0.0012) Jy beam−1 for the red (blue) channels, respectively. The C17O synthesized beam (0.″21 × 0.″13) is the bottom rightmost ellipse on each of the panels, and the continuum synthesized beam (0.″11 × 0.″05) is offset diagonally.
Other Images in This Article

Show More
Copyright and Terms & Conditions
© 2021. The American Astronomical Society. All rights reserved.