Image Details
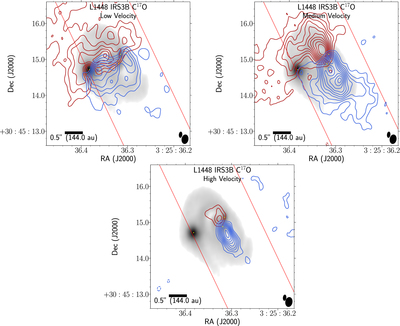
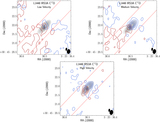
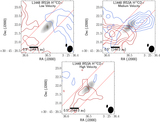
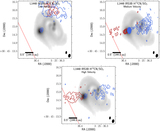
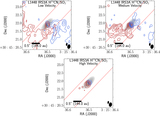
Caption: Figure 4.
C17O integrated intensity maps toward IRS3B over a selected range of velocities overlaid on continuum (gray scale). The C17O emission traces the rotating gas within the disk via Doppler-shifted emission. The panels correspond to low-, medium-, and high-velocity ranges. The following panel descriptions will be noted red (blue), corresponding to the Doppler shifted emission. Negative contours are not present in these integrated intensity maps; however, at the location of IRS3B-c, there is strong absorption that is evident in the high spectral resolution data cube but is not represented here. The red lines indicate the region extracted for PV diagram construction, along the position angle of the major axis. Low velocity: velocity range starts at 4.68 ﹩\to ﹩ 5.67 km s−1 (3.58 ﹩\to ﹩ 4.68 km s−1) and contours start at 8σ (8σ) and iterate by 3σ (3σ) with the 1σ level starting at 0.0023 (0.0025) Jy beam−1 for the red (blue) channels, respectively. Medium velocity: velocity range starts at 5.67 ﹩\to ﹩ 6.66 km s−1 (2.48 ﹩\to ﹩ 3.58 km s−1) and contours start at 3σ (5σ) and iterate by 3σ (3σ) with the 1σ level starting at 0.002 (0.0016) Jy beam−1 for the red (blue) channels, respectively. High velocity: velocity range starts at 6.66 ﹩\to ﹩ 7.65 km s−1 (1.27 ﹩\to ﹩ 2.48 km s−1) and contours start at 5σ (5σ) and iterate by 3σ (3σ) with the 1σ level starting at 0.0018 (0.0012) Jy beam−1 for the red (blue) channels respectively. The C17O synthesized beam (0.″21 × 0.″13) is the bottom rightmost ellipse on each of the panels, and the continuum synthesized beam (0.″11 × 0.″05) is offset diagonally.
Other Images in This Article

Show More
Copyright and Terms & Conditions
© 2021. The American Astronomical Society. All rights reserved.