Image Details
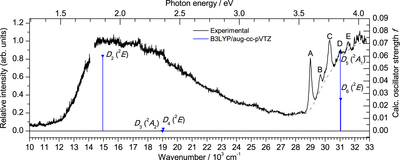
Caption: Figure 3.
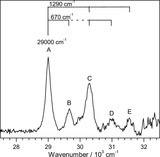
Total EPD spectrum of Ada+ in the spectral range 10,000–33,000 cm−1 compared to stick spectra of vertical transitions of Ada+ originating from its 2A1 ground electronic state obtained by TD-DFT calculations (B3LYP/aug-cc-pVTZ; Table 1). The gray dotted line, generated using a spline from the part of the curve between the peaks, is subtracted from the spectrum to analyze the vibronic peaks (labeled A–E) in Figure 4.
Other Images in This Article
Copyright and Terms & Conditions
© 2020. The American Astronomical Society. All rights reserved.
Copyright ©
2025 Astronomy Image Explorer. All Rights Reserved.