Image Details
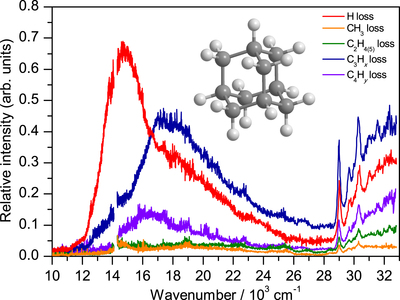
Caption: Figure 2.
Mass-resolved EPD spectra of Ada+ (﹩{{\rm{C}}}_{10}{{{\rm{H}}}_{16}}^{+}﹩) recorded in various fragment channels. The sum of all channels yields the total EPD spectrum shown in Figure 3. The intensities are displayed relative to the maximum value of the total EPD spectrum.
Other Images in This Article
Copyright and Terms & Conditions
© 2020. The American Astronomical Society. All rights reserved.
Copyright ©
2025 Astronomy Image Explorer. All Rights Reserved.