Image Details
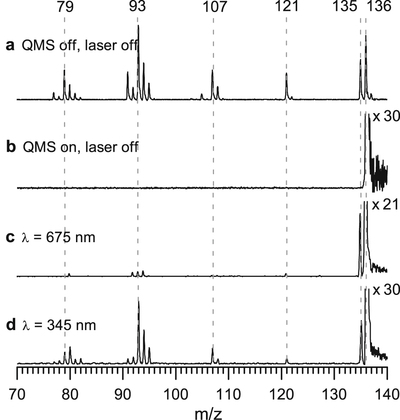
Caption: Figure 1.
Reflectron time-of-flight mass spectra of Ada+ formed by EI at 50 eV. (a) Mass spectrum of the ion source. (b) Mass spectrum of the ion source with mass selection of Ada+ using the QMS. (c), (d) EPD mass spectra of Ada+ obtained at 675 and 345 nm. The mass spectra in (b)–(d) are multiplied by 21 and 30 to show the weak peaks.
Other Images in This Article
Copyright and Terms & Conditions
© 2020. The American Astronomical Society. All rights reserved.
Copyright ©
2025 Astronomy Image Explorer. All Rights Reserved.