Image Details
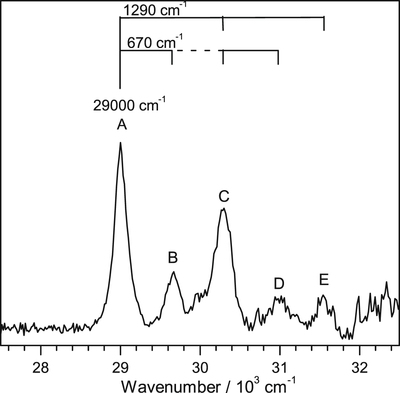
Caption: Figure 4.
Expanded view of the total EPD spectrum of Ada+ in the high frequency range (after background subtraction, Figure 3) to illustrate the vibronic progressions.
Other Images in This Article
Copyright and Terms & Conditions
© 2020. The American Astronomical Society. All rights reserved.
Copyright ©
2025 Astronomy Image Explorer. All Rights Reserved.