Image Details
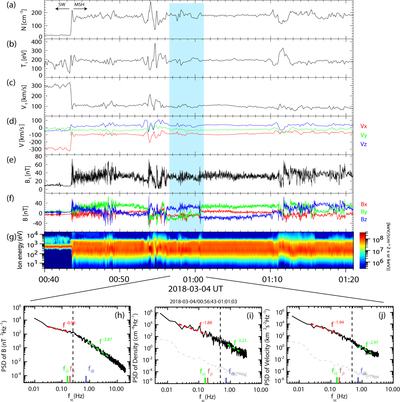
Caption: Figure 1.
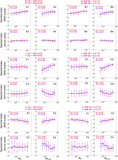
An example of magnetosheath observations made by MMS-1 on 2018 March 4. From top to bottom, panels (a)–(g) show the survey-mode time series: (a) ion number density; (b) ion temperature; (c) the bulk speed of ions; (d) three components of ion velocity in GSE coordinates; (e) magnetic field strength; (f) three components of magnetic field in GSE coordinate; (g) ion energy spectra. The light blue area represents the burst-mode interval in the magnetosheath. Based on the burst-mode data, the omnidirectional magnetic-field spectrum, the ion density spectrum, and the omnidirectional ion velocity are calculated and shown in (h), (i), and (j), respectively. The dashed lines represent the fitting results at MHD scales (in red) and at sub-ion scales (in green). The vertical lines denote different frequencies, such as the break frequency fb (in black), the ion-cyclotron frequency ﹩{f}_{\mathrm{ci}}﹩ (in green), the Doppler-shifted frequencies corresponding to the proton gyroradius ﹩{f}_{\rho {\rm{i}}}﹩, and the Doppler-shifted frequencies corresponding to the ion inertial length ﹩{f}_{\mathrm{di}}﹩. The gray dashed lines in (i) and (j) represent the noise floor of the instrument.
Other Images in This Article
Copyright and Terms & Conditions
© 2020. The American Astronomical Society. All rights reserved.