Image Details
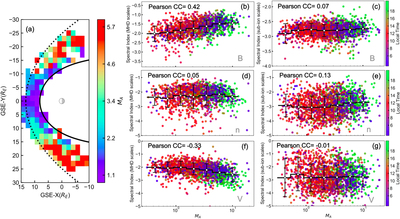
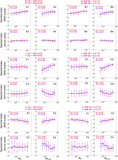
Caption: Figure 2.
Evolution of magnetosheath turbulence from the subsolar region to the flanks. Panel (a) gives the 2D distribution of the Alfvén Mach number, ﹩{M}_{{\rm{A}}}﹩, in the GSE-XY plane of the magnetosheath. The black solid and the black dotted curves represent the nominal position of the Earth’s magnetopause and the bow shock estimated from the models proposed by Shue et al. (1997) and Chao et al. (2002), respectively. Panels (b), (d), and (f) present the magnetic-field spectral indices, the density spectral indices, and the velocity spectral indices at MHD scales as a function of ﹩{M}_{{\rm{A}}}﹩. The results for sub-ion scales are accordingly given in panels (c), (e), and (g). The color of the data points indicates the local time. The black horizontal line represents the mean value for each bin, and the vertical line represents the standard deviation. CC represents the correlation coefficient between the spectral slope and ﹩{\mathrm{log}}_{10}{M}_{{\rm{A}}}﹩.
Other Images in This Article
Copyright and Terms & Conditions
© 2020. The American Astronomical Society. All rights reserved.