Image Details
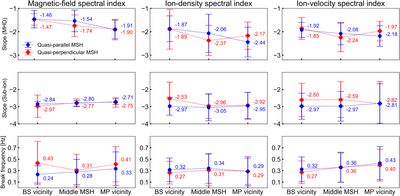
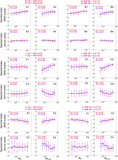
Caption: Figure 3.
Evolution of magnetosheath turbulence from the bow shock to the magnetopause. In the top row, the three panels show the spectral slopes at MHD scales for magnetic-field spectra, density spectra, and velocity spectra, respectively. The results at sub-ion scales are given in the three panels in the middle row. The break frequency is given in the bottom three panels. The averaged values are denoted by blue circles (quasi-parallel magnetosheath) and red diamonds (quasi-perpendicular magnetosheath). The error bars indicate the standard deviation.
Other Images in This Article
Copyright and Terms & Conditions
© 2020. The American Astronomical Society. All rights reserved.
Copyright ©
2026 Astronomy Image Explorer. All Rights Reserved.