

Image Details
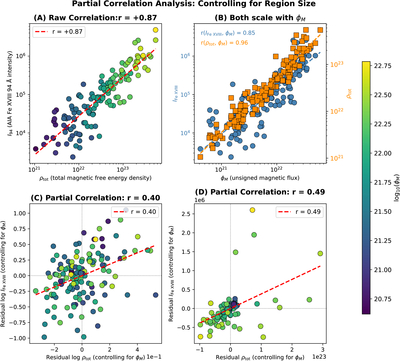
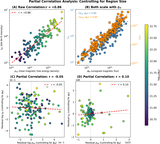
Caption: Figure 8.
Illustration of the partial correlation analysis for ρtot versus IFe XVIII. (A) Raw correlation shows a strong positive relationship. (B) Both variables scale with unsigned flux ΦM, suggesting the correlation in (A) is driven by region size. (C) Partial correlation between logarithmic residuals reveals a positive relationship. (D) Partial correlation between linear residuals also shows a positive relationship: regions with excess magnetic energy (for their size) have higher Fe XVIII Å emission. Note that this analysis uses the recalculated value of ρtot.
Other Images in This Article
Copyright and Terms & Conditions
© 2026. The Author(s). Published by the American Astronomical Society.

Copyright ©
2026 Astronomy Image Explorer. All Rights Reserved.
