

Image Details
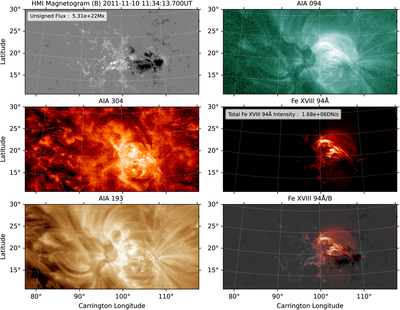
Caption: Figure 1.
Overview of AR 11339 observed on 2011 November 10 and included in our sample. Left column, top: HMI line-of-sight magnetogram extracted from the SHARP dataset. We show the precomputed total unsigned magnetic flux from the SHARP header in the legend. Left column, center: AIA 304 Å image showing the lower transition region at ∼0.09 MK. Left column, bottom: AIA 193 Å image showing the corona at ∼1.4 MK. Right column, top: AIA 94 Å image showing the corona at ∼7.1 MK. Right column, center: image showing the Fe XVIII 93.926 Å intensity after isolation from the AIA 94 Å channel using the method of H. P. Warren et al. (2012). We show the total intensity in the SHARP field-of-view (FOV) in the legend. Right column, bottom: Fe XVIII 93.926 Å image overlaid on the HMI magnetogram to show the accuracy of the coalignment procedure.
Other Images in This Article
Copyright and Terms & Conditions
© 2026. The Author(s). Published by the American Astronomical Society.

