

Image Details
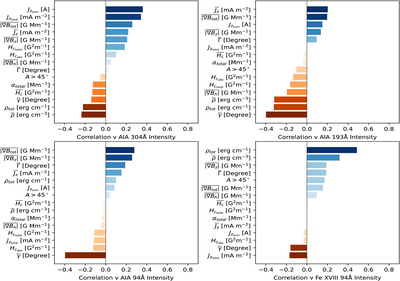
Caption: Figure 4.
Horizontal bar plots showing the linear Pearson partial correlation ranking order between each SHARP magnetic parameter and each AIA filter intensity after controlling for total magnetic flux (ΦM). The x range of the plots is the same as Figure 3 for easier comparison. Note that the values of ﹩\bar{\rho }﹩, ρtot, ﹩\bar{{\rm{\Gamma }}}﹩, and ﹩{A}_{{\rm{shear}}\gt 4{5}^{\circ }}﹩ are recalculated as discussed in the text.
Other Images in This Article
Copyright and Terms & Conditions
© 2026. The Author(s). Published by the American Astronomical Society.

Copyright ©
2026 Astronomy Image Explorer. All Rights Reserved.
