

Image Details
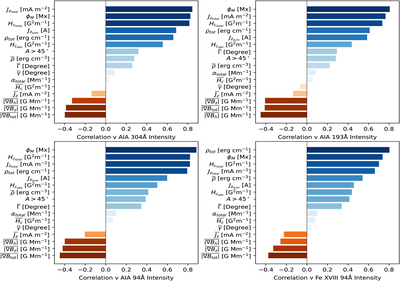
Caption: Figure 3.
Horizontal bar plots showing the linear Pearson-correlation ranking order between each SHARP magnetic parameter and each AIA filter intensity (including the intensity for the isolated Fe XVIII 93.926 Å emission). Note that the values of ﹩\bar{\rho }﹩, ρtot, ﹩\bar{{\rm{\Gamma }}}﹩, and ﹩{A}_{{\rm{shear}}\gt 4{5}^{\circ }}﹩ are recalculated as discussed in the text.
Other Images in This Article
Copyright and Terms & Conditions
© 2026. The Author(s). Published by the American Astronomical Society.

Copyright ©
2026 Astronomy Image Explorer. All Rights Reserved.
