

Image Details
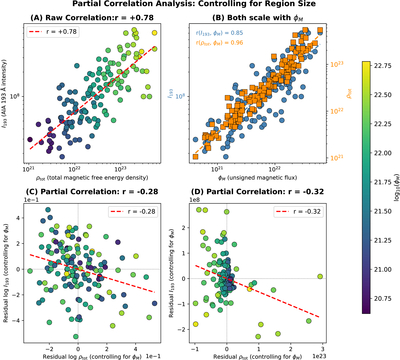
Caption: Figure 6.
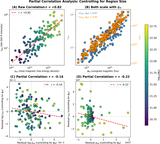
Illustration of the partial correlation analysis for ρtot versus I193. (A) Raw correlation shows a strong positive relationship. (B) Both variables scale with unsigned flux ΦM, suggesting the correlation in (A) is driven by region size. (C) Partial correlation between logarithmic residuals shows no relationship. (D) Partial correlation between linear residuals reveals a weak negative relationship: regions with excess magnetic energy (for their size) have lower 193 Å emission. Note that this analysis uses the recalculated value of ρtot.
Other Images in This Article
Copyright and Terms & Conditions
© 2026. The Author(s). Published by the American Astronomical Society.

Copyright ©
2026 Astronomy Image Explorer. All Rights Reserved.
