

Image Details
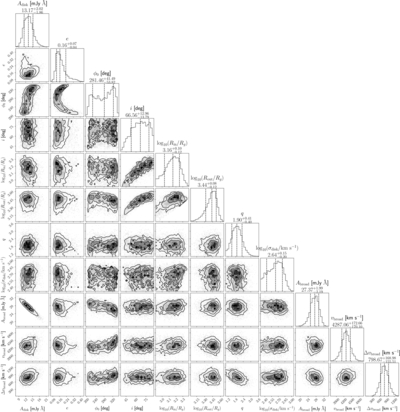
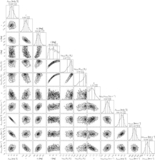
Caption: Figure A2.
Reduced posterior corner plot for the representative TDE Full Model fit to the AT 2018hyz spectrum observed at MJD 58539.5. The plotted parameter set matches Figure A1, allowing the AGN and TDE posterior geometries to be compared directly. As in the AGN example, the dominant correlations reflect the finite information content of a single broad-line profile and are incorporated into the reported posterior uncertainties.
Other Images in This Article
Copyright and Terms & Conditions
© 2026. The Author(s). Published by the American Astronomical Society.

Copyright ©
2026 Astronomy Image Explorer. All Rights Reserved.
