

Image Details
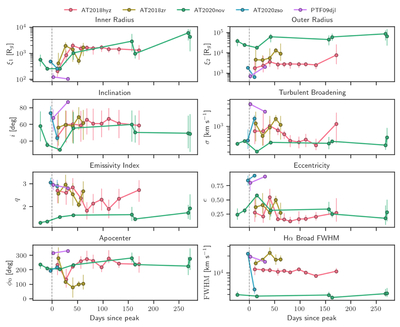
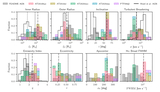
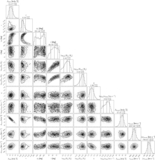
Caption: Figure 6.
Time evolution of the fitted elliptical-disk model parameters for the five TDEs in our sample. Each panel shows one of the eight parameters (the seven disk parameters along with the FWHM of the broad Gaussian component when included). Time is normalized individually for each TDE, with t = 0 corresponding to the epoch of maximum observed brightness in the optical light curves. Points represent the posterior medians at each epoch, with error bars indicating the 16th–84th percentile credible intervals. The evolving parameter values reflect changes in the line-emitting region and disk structure over time.
Other Images in This Article
Copyright and Terms & Conditions
© 2026. The Author(s). Published by the American Astronomical Society.

