

Image Details
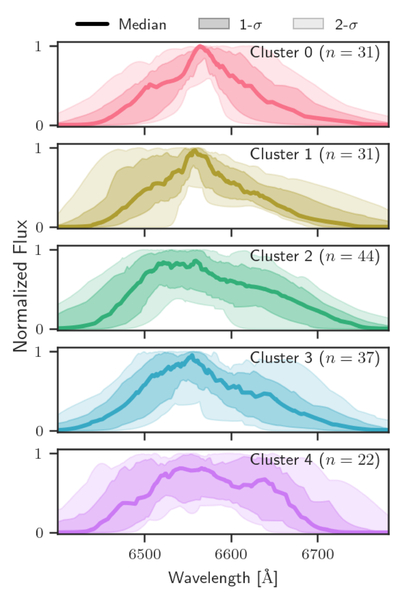
Caption: Figure 5.
Median rest-frame Hα reconstructed disk-component profiles for each of the five AGN Gaussian-mixture morphology bins. The figure shows only the fitted elliptical-disk component, not the observed data or the total model including narrow lines and the additional broad Gaussian. Solid lines represent the median normalized disk profile within each bin, while the shaded regions denote the 16th–84th percentile range (dark shading) and the 5th–95th percentile range (light shading) at each wavelength. Individual reconstructed disk profiles were normalized and interpolated onto a common grid prior to stacking. The profiles illustrate the diversity in disk-component line shape and structure across the bins, with some groups showing compact centrally concentrated disk profiles and others exhibiting broader, more extended, or more asymmetric disk emission.
Other Images in This Article
Copyright and Terms & Conditions
© 2026. The Author(s). Published by the American Astronomical Society.

