

Image Details
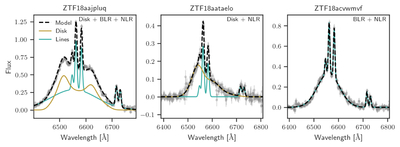
Caption: Figure 2.
Representative examples of the three model families used to fit the AGN spectra in this work. Each panel shows an observed AGN spectrum (gray), together with the corresponding best-fit model (black dashed line). The contribution from the elliptical accretion disk is shown in gold, while all nondisk line-emission components (narrow lines and the broad Gaussian) are shown in cyan. These examples illustrate the qualitative behavior of the disk+BLR, no BLR, and no disk model families (see Section 4) and highlight the different ways in which disk and nondisk components combine to reproduce the observed Hα line profiles.
Other Images in This Article
Copyright and Terms & Conditions
© 2026. The Author(s). Published by the American Astronomical Society.

