

Image Details
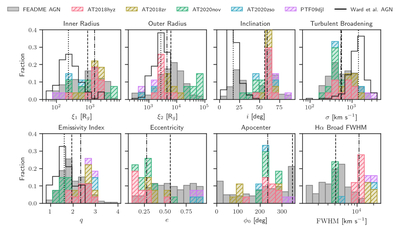
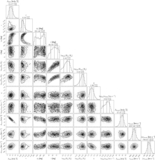
Caption: Figure 7.
Empirical distributions of posterior-median parameters for the FEADME AGN and TDE fits, together with the published best-fitting circular-disk plus spiral-arm parameters from C. Ward et al. (2024). Gray histograms show the FEADME AGN, colored stacked histograms show the TDE epochs separated by event, and black step histograms show the Ward et al. (2024) values for the 162 AGN shared with the disk-bearing FEADME sample. The C. Ward et al. distributions are included for inclination, inner and outer radius, emissivity index, and local broadening, which are defined in both disk prescriptions. Black vertical lines mark the corresponding population medians: dashed lines represent the FEADME AGNs, dashed–dotted lines represent the FEADME TDEs, and dotted lines represent the C. Ward et al. (2024) AGNs. The apocenter panel uses a circular median for the FEADME populations, and each population is normalized independently. The C. Ward et al. (2024) distributions use object-level best fits, whereas the FEADME distributions use posterior medians.
Other Images in This Article
Copyright and Terms & Conditions
© 2026. The Author(s). Published by the American Astronomical Society.

