

Image Details
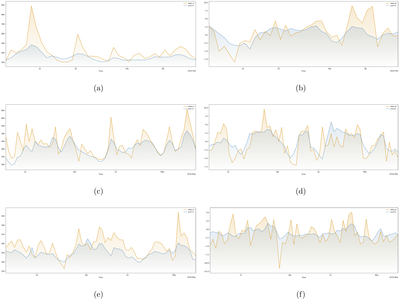
Caption: Figure 9.
Comparison of the model single-step predictions at the near-Earth grid point with OMNI observations of vr (left column) and Br (right column) for three other solar activity phases: (a)–(b) the maximum of solar cycle 24 (2014 January 8–February 14); (c)–(d) the declining phase of solar cycle 24 (2016 March 8–May 12); (e)–(f) the minimum between solar cycles 24 and 25 (2019 March 4–May 8). Combined with the rising-phase window in Figure 8, the near-Earth comparison covers the four phases of the solar activity cycle. Blue and orange solid curves show the model predictions and OMNI observations, respectively; matching shading fills the area beneath each curve. The plotted time periods are continuous test blocks located in the corresponding stages of the dataset partitioning.
Other Images in This Article
Copyright and Terms & Conditions
© 2026. The Author(s). Published by the American Astronomical Society.

