

Image Details
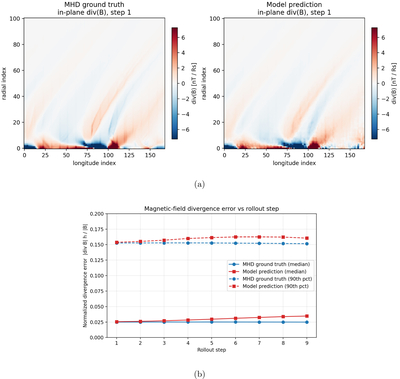
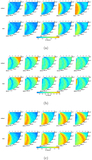
Caption: Figure 7.
In-plane magnetic field divergence diagnostics. (a) Spatial distributions of the in-plane ∇ · B (in nT ﹩{R}_{s}^{-1}﹩) for the MHD true values (left) and the model prediction (right) at the first rolling step for a representative test sample; (b) the median (solid line) and 90th percentile (dashed line) of the normalized in-plane divergence ﹩\frac{| {\rm{\nabla }}\cdot {\boldsymbol{B}}| \,h}{| {\boldsymbol{B}}| }﹩ as functions of the number of rolling steps, for the model prediction (red squares) and the MHD true values (blue circles) calculated using the same finite-difference operator.
Other Images in This Article
Copyright and Terms & Conditions
© 2026. The Author(s). Published by the American Astronomical Society.

Copyright ©
2026 Astronomy Image Explorer. All Rights Reserved.
