

Image Details
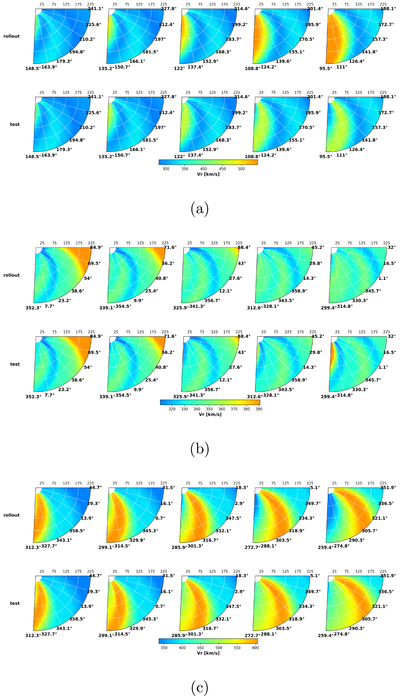
Caption: Figure 5.
Comparison of the model rolling predictions (top row of each panel) of the radial velocity vr on the solar equatorial plane with the corresponding MHD test-set true values (bottom row) in three representative test windows (a)–(c). The three windows are taken from different periods of the test set. The polar coordinate grid covers the heliocentric distance range of 25Rs–225Rs, with radial ticks in units of Rs and angular ticks indicating the heliographic Carrington longitude of each angular bin. The columns from left to right correspond to the consecutive rolling steps 1–5, each with Δt = 24 hr. The color scale indicates the magnitude of vr; each panel uses a color-scale range determined by the 2nd–98th percentiles of its own data.
Other Images in This Article
Copyright and Terms & Conditions
© 2026. The Author(s). Published by the American Astronomical Society.

