

Image Details
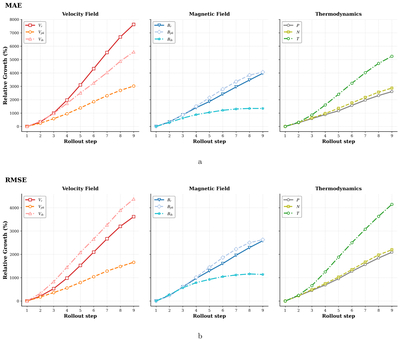
Caption: Figure 6.
Relative growth rates of (a) MAE and (b) RMSE as functions of the number of rolling prediction steps on the test set. The variables are divided into three groups: velocity components (vr, vϕ, vθ), magnetic field components (Br, Bϕ, Bθ), and plasma quantities—dynamic pressure P, number density N, and temperature T. Solid, dashed, and dash-dotted curves identify the first, second, and third quantities in each group, respectively. The corresponding markers are squares, circles, and upward triangles for velocity; downward triangles, diamonds, and stars for the magnetic field; and pentagons, crosses, and hexagons for plasma quantities. The growth rate is defined as ﹩\frac{{E}_{t}-{E}_{1}}{{E}_{1}}\times 100 \% ﹩, where Et represents the MAE or RMSE of the tth rolling step and E1 represents the corresponding error of the first step. Each step corresponds to a forecast advance of Δt = 24 hr, with a maximum lead time of 9 days.
Other Images in This Article
Copyright and Terms & Conditions
© 2026. The Author(s). Published by the American Astronomical Society.

