

Image Details
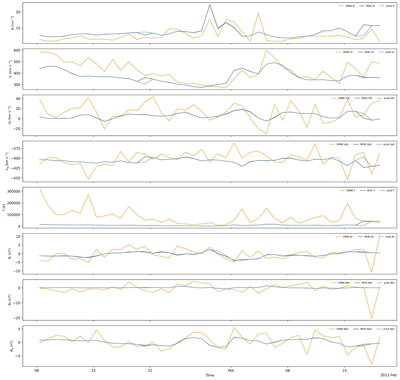
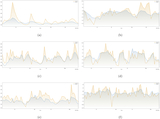
Caption: Figure 8.
Comparison of the model single-step predictions (blue), MHD true values (dark gray), and OMNI observations (orange) at the near-Earth grid point during the rising phase of solar cycle 24 (2011 January 8 to February 19). From top to bottom, the panels show the number density N, radial velocity vr, transverse velocities vθ and vϕ, temperature T in kelvin, and magnetic field components Br, Bθ, and Bϕ. The prediction closely follows the MHD true values across all eight channels. In the temperature panel, both series have been converted from MHD code units to kelvin; their shared deviation from the OMNI proton temperature and weak temporal consistency stem from the reconstruction target itself.
Other Images in This Article
Copyright and Terms & Conditions
© 2026. The Author(s). Published by the American Astronomical Society.

