

Image Details
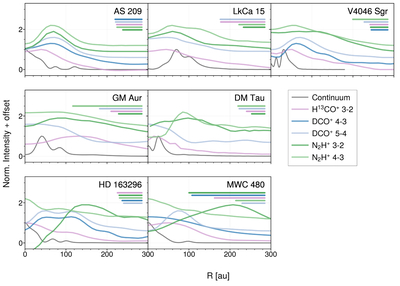
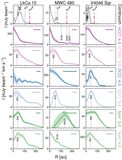
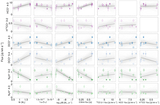
Caption: Figure 6.
Radial intensity profiles for molecular ions and continuum emission normalized to a maximum value of one, with vertical offsets added in increments of 0.3 to make individual profiles more visible. Beam sizes for the molecular ion profiles are plotted as horizontal bars in the same color as the corresponding molecular tracer. Top row: T Tauri sources with radially coincident emission rings. Middle row: T Tauri sources with varied ion emission morphologies. Bottom row: Herbig sources with varied ion emission morphologies.
Other Images in This Article
Copyright and Terms & Conditions
© 2026. The Author(s). Published by the American Astronomical Society.

Copyright ©
2026 Astronomy Image Explorer. All Rights Reserved.
