

Image Details
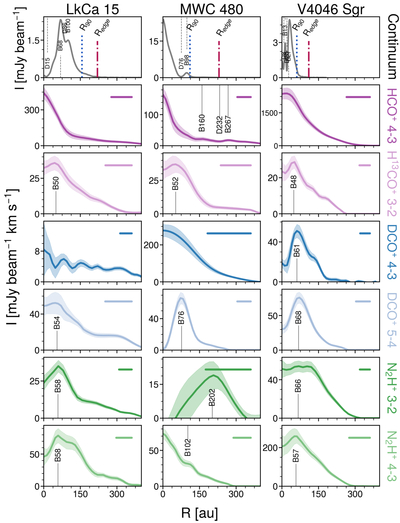
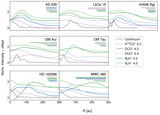
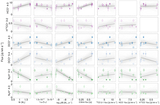
Caption: Figure 3.
Deprojected radial intensity profiles for all of the lines in our survey, as listed in Table 2. A horizontal bar in the upper right corner of each panel represents the FWHM of the synthesized beam. In the top row we include the deprojected radial intensity profiles for high-resolution continuum observations from the MAPS and exoALMA Large Programs, at frequencies of 260 and 331 GHz, respectively (C. J. Law et al. 2021; P. Curone et al. 2025). We plot the published R90 values as well as millimeter dust edge locations (Redge), identified by visual inspection, as blue dotted and red dashed–dotted lines, respectively. Several of the MAPS disks have additional low-contrast dust rings and gaps located at <40 au that were identified by J. Huang et al. (2018, 2020) but are not plotted here as they were not resolved in the 260 GHz MAPS data. For full details on the characterization of substructures in the continuum profiles see C. J. Law et al. (2021) and P. Curone et al. (2025).
Other Images in This Article
Copyright and Terms & Conditions
© 2026. The Author(s). Published by the American Astronomical Society.

