

Image Details
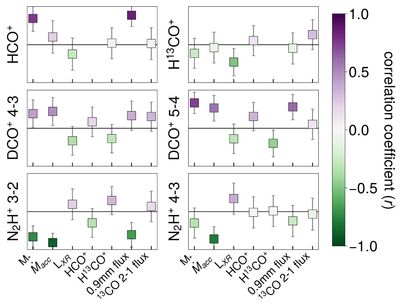
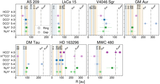
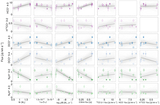
Caption: Figure 4.
Panels show the median correlation coefficients for each molecular line (labeled to the left of each panel) and different source parameters, with error bars representing one standard deviation. Marker colors map to the color bar representing the correlation coefficient, with positive values in purple and negative values in green. The horizontal axis is labeled by the source parameters tested for correlations, including stellar mass, mass accretion rate, stellar X-ray luminosity, HCO+ flux, H13CO+ flux, 0.9 mm continuum flux, and 13CO flux from left to right.
Other Images in This Article
Copyright and Terms & Conditions
© 2026. The Author(s). Published by the American Astronomical Society.

Copyright ©
2026 Astronomy Image Explorer. All Rights Reserved.
