

Image Details
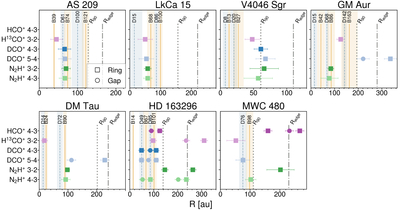
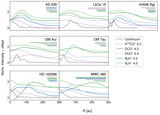
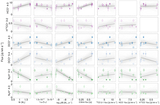
Caption: Figure 5.
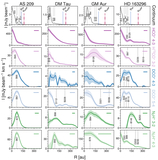
Ion substructure locations from this work are plotted as square and circular markers for rings and gaps, respectively, with colors corresponding to the radial profiles in Figure 3. Continuum substructure, including rings (solid orange) and gaps (dashed blue), are plotted as vertical lines in the background with shading representing the estimated width of the dust substructures. R90 and the visual millimeter dust edge Redge are plotted as gray dotted and dashed–dotted lines, respectively.
Other Images in This Article
Copyright and Terms & Conditions
© 2026. The Author(s). Published by the American Astronomical Society.

Copyright ©
2026 Astronomy Image Explorer. All Rights Reserved.
