

Image Details
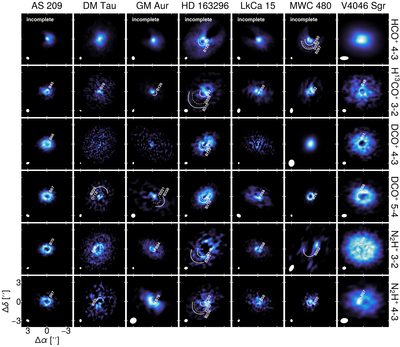
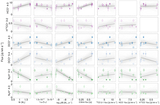
Caption: Figure 1.
Zeroth-moment maps of the target molecular ions across the sample. Rings and gaps from Table C1 are labeled and shown as solid and dotted arcs, respectively. Beam sizes are shown in the lower left corner of each panel. We note the data cutoff issue (i.e., insufficient spectral range that does not cover the full line profile), which effects the HCO+ cubes for AS 209, GM Aur, HD 163296, LkCa 15, and MWC 480 (see Section 3.2).
Other Images in This Article
Copyright and Terms & Conditions
© 2026. The Author(s). Published by the American Astronomical Society.

Copyright ©
2026 Astronomy Image Explorer. All Rights Reserved.
