

Image Details
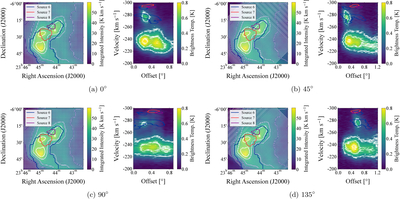
Caption: Figure 7.
Integration paths with different position angles (from 0° to 135°) are constructed using the original data. In each panel, the left image shows the integration path and width, indicated by white points, with an integration width of 60′. For better visualization, the color bar ranges from 0 to 60 K km s−1, while the overlaid contours follow the same contour levels as in Figure 2. The blue, red, and purple contours outline Source 6, 7, and 8, respectively, with Source 6 further divided into Sources 6a and 6b. Source 1 extends over nearly the entire displayed area. The right image presents the corresponding P-V diagram, overlaid with 3σ, 5σ, and 7σ contours at 0.36, 0.60, and 0.84 K, respectively. Source boundaries are marked using the same colors as in the left image.
Other Images in This Article
Copyright and Terms & Conditions
© 2026. The Author(s). Published by the American Astronomical Society.

