

Image Details
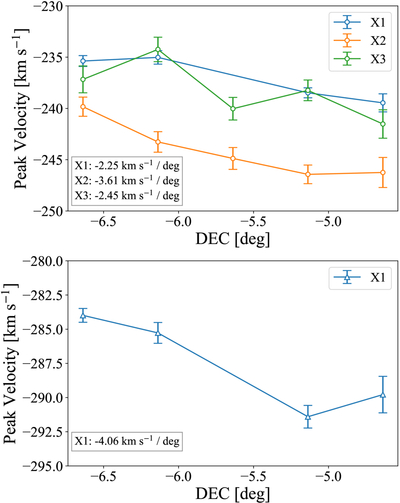
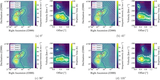
Caption: Figure 4.
Velocity variation as a function of decl. The upper panel shows the mean peak velocities around −240 km s−1, marked with circles, while the lower panel shows the mean peak velocities around −280 km s−1, marked with triangles. The velocity uncertainties are estimated from the standard deviation of the peak velocities divided by the square root of the number of independent beams. The same color denotes the same filament.
Other Images in This Article
Copyright and Terms & Conditions
© 2026. The Author(s). Published by the American Astronomical Society.

Copyright ©
2026 Astronomy Image Explorer. All Rights Reserved.
