

Image Details
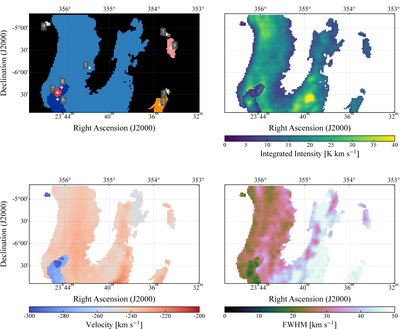
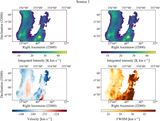
Caption: Figure 5.
Moment 0, moment 1, and FWHM maps of the nine cataloged H I sources for threshold = 2 and FWHM range = 0.7. All panels are constructed from the ROHSA Gaussian fitting results. The left image in the first row shows the shape and location of the nine sources, marked with different colors. The moment 0, moment 1, and FWHM maps are derived from the corresponding fitted Gaussian components.
Other Images in This Article
Copyright and Terms & Conditions
© 2026. The Author(s). Published by the American Astronomical Society.

Copyright ©
2026 Astronomy Image Explorer. All Rights Reserved.
