

Image Details
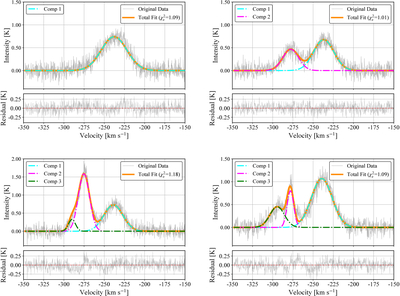
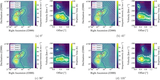
Caption: Figure 6.
Four representative individual-pixel spectra of the cataloged H I sources, together with the Gaussian fitting results. Only Gaussian components above threshold = 2 are shown. The original spectra are shown in black, with the best-fit in orange and independent Gaussian components in cyan, purple, and green. All spectra are fitted using the ROHSA model with N = 3. In the bottom row, the left panel shows an example that satisfies the adopted merging criteria, whereas the right panel shows an example that does not satisfy the merging criteria.
Other Images in This Article
Copyright and Terms & Conditions
© 2026. The Author(s). Published by the American Astronomical Society.

Copyright ©
2026 Astronomy Image Explorer. All Rights Reserved.
