

Image Details
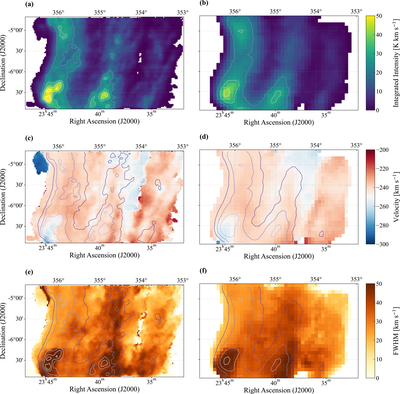
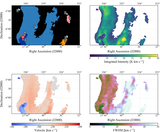
Caption: Figure 2.
Comparison of the CRAFTS and HI4PI observations. Panels (a) and (b) show the integrated intensity maps (moment 0 maps) derived from CRAFTS and HI4PI, respectively. The color scale and contours range from 0 to 50 K km s-1, with a contour interval of 10 K km s-1. Panels (c) and (d) show the corresponding velocity field maps (moment 1 maps), with the color scale ranging from -300 to -200 km s-1. Panels (e) and (f) show the corresponding FWHM maps, with the color scale ranging from 0 to 50 km s-1. The contours in panels (c) - (f) are the same as those in panels (a) and (b).
Other Images in This Article
Copyright and Terms & Conditions
© 2026. The Author(s). Published by the American Astronomical Society.

Copyright ©
2026 Astronomy Image Explorer. All Rights Reserved.
