

Image Details
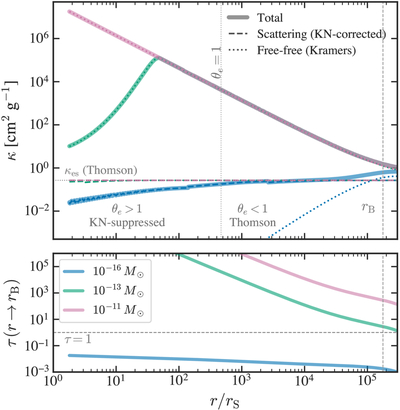
Caption: Figure 3.
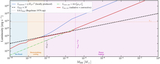
Opacity (top) and cumulative optical depth (bottom) as a function of r/rS for MBH = 10−16, 10−13, and 10−11 M⊙. Thick translucent lines show the total opacity; dashed lines show Klein–Nishina-corrected scattering; and dotted lines show Kramers free–free absorption. The vertical dotted line marks the θe = 1 boundary separating the Klein–Nishina-suppressed and Thomson regimes. The horizontal dashed line in the lower panel marks τ = 1.
Other Images in This Article
Copyright and Terms & Conditions
© 2026. The Author(s). Published by the American Astronomical Society.

Copyright ©
2026 Astronomy Image Explorer. All Rights Reserved.
