

Image Details
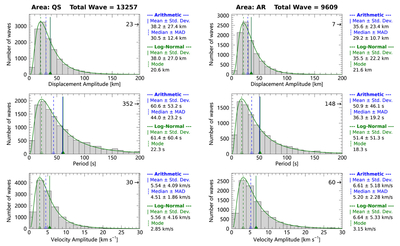
Caption: Figure 3.
Histograms of wave properties for QS (left) and AR (right) fibrils. From top to bottom, the panels display the displacement amplitude, period, and velocity amplitude. Histograms denote the measured distributions, while green curves represent log-normal fits. Blue solid and dashed vertical lines mark the arithmetic mean and median, respectively, and green solid and dashed vertical lines mark the log-normal mean and mode, respectively. The total number of detected waves is indicated at the top of each column.
Other Images in This Article
Copyright and Terms & Conditions
© 2026. The Author(s). Published by the American Astronomical Society.

Copyright ©
2026 Astronomy Image Explorer. All Rights Reserved.
