

Image Details
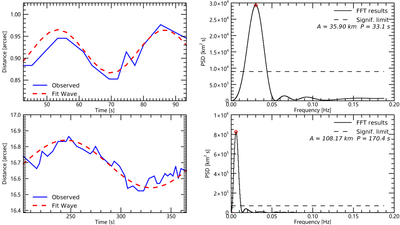
Caption: Figure 4.
Examples of transverse wave signals identified in chromospheric fibrils. The upper and lower rows show two examples of a small-amplitude high-frequency oscillation and a large-amplitude low-frequency oscillation, respectively. The corresponding Fourier power spectra confirm the dominant oscillation periods, with the red diamond marking the primary peak.
Other Images in This Article
Copyright and Terms & Conditions
© 2026. The Author(s). Published by the American Astronomical Society.

Copyright ©
2026 Astronomy Image Explorer. All Rights Reserved.
