

Image Details
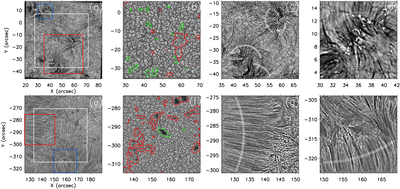
Caption: Figure 1.
Overview of the QS and AR observations. Panels (a) and (e) show the Hα images of the QS and AR, respectively. Panels (b) and (f) show the corresponding 450.3 nm blue continuum images, with fields of view indicated by the white boxes in panels (a) and (e). The red and green contours in panels (b) and (f) represent positive and negative polarity SDO/HMI LOS magnetic fields, respectively, at levels of ±20 G for the QS and ±300 G for the AR. Panels (c) and (g) show enlarged views of the regions outlined by the red boxes in panels (a) and (e), while panels (d) and (h) show enlarged views of the regions outlined by the blue boxes. The slit locations used for the time–distance analysis are marked by white lines.
Other Images in This Article
Copyright and Terms & Conditions
© 2026. The Author(s). Published by the American Astronomical Society.

