

Image Details
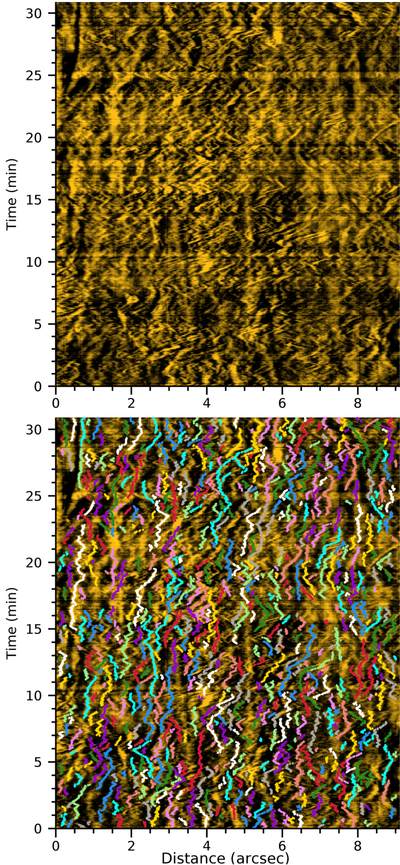
Caption: Figure 2.
One example of time–distance diagrams obtained from the slits. Because the image intensities were inverted for visualization, the oscillating fibrils appear as bright thread-like structures. In the lower panel, the colored tracks indicate the reliable oscillation threads.
Other Images in This Article
Copyright and Terms & Conditions
© 2026. The Author(s). Published by the American Astronomical Society.

Copyright ©
2026 Astronomy Image Explorer. All Rights Reserved.
