

Image Details
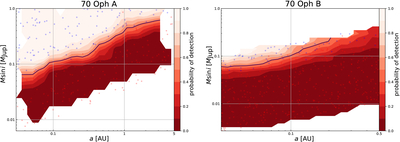
Caption: Figure 12.
Detection completeness for 70 Oph A (left) and 70 Oph B (right) derived using rvsearch injection–recovery simulations. Synthetic Keplerian signals were injected into the RV data assuming circular orbits (e = 0). The completeness map for 70 Oph A uses the combined Keck/HIRES, APF, and PFS dataset, while the map for 70 Oph B is based on the high-cadence PFS data alone. Background shading indicates the interpolated recovery probability as a function of semimajor axis and ﹩M\sin i﹩. Individual injection trials are shown as points, with blue circles denoting recovered signals and red circles indicating nonrecovered signals. The solid black curve marks the 50% completeness contour, and the other gradient contour lines show completeness levels from 10% to 90%.
Other Images in This Article
Show More
Copyright and Terms & Conditions
© 2026. The Author(s). Published by the American Astronomical Society.

