

Image Details
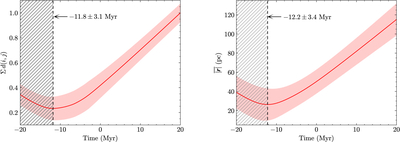
Caption: Figure 7.
Left: evolution of the sum of distances between the six subregions, Σd(i, j), normalized by its maximum. Right: evolution of the mean distance of the six subregions from the S205 reference center, ﹩\overline{| {\boldsymbol{r}}| }﹩. Time range is ±20 Myr. Vertical dashed lines in the two panels indicate the times when Σd(i, j) and ﹩\overline{| {\boldsymbol{r}}| }﹩ reach minimum values, respectively.
Other Images in This Article
Show More
Copyright and Terms & Conditions
© 2026. The Author(s). Published by the American Astronomical Society.

Copyright ©
2026 Astronomy Image Explorer. All Rights Reserved.
