

Image Details
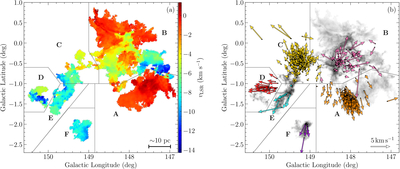
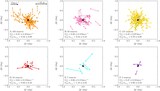
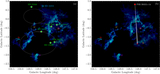
Caption: Figure 2.
(a) LSR velocity distribution map of 12CO emission. Gray solid lines mark the boundaries of six identified subregions (A–F). (b) Locations and residual tangential motions of young stars. Black dots denote locations of young stars, and arrows depict their residual tangential motions after subtracting the bulk tangential motion of the region. Here, the unit of mas yr−1 is converted to km s−1 using the parallaxes of young stars. Subregions A–F are colored orange, pink, yellow, red, cyan, and purple, respectively.
Other Images in This Article
Show More
Copyright and Terms & Conditions
© 2026. The Author(s). Published by the American Astronomical Society.

Copyright ©
2026 Astronomy Image Explorer. All Rights Reserved.
