

Image Details
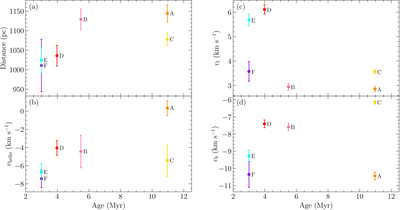
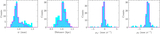
Caption: Figure 3.
Overview of four average parameters as derived for the six subregions. Panels (a), (b), (c), and (d) show the distances, vhelio, vl, and vb, respectively. Error bars represent their respective uncertainties. Colors of subregions match Figure 2 (b). The subregions are ordered by age (see Table 5).
Other Images in This Article
Show More
Copyright and Terms & Conditions
© 2026. The Author(s). Published by the American Astronomical Society.

Copyright ©
2026 Astronomy Image Explorer. All Rights Reserved.
