

Image Details
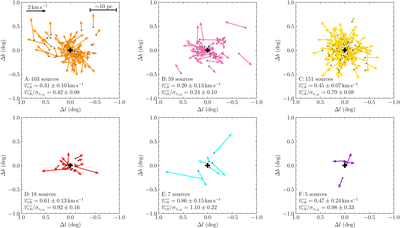
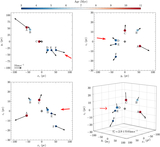
Caption: Figure 5.
Internal motions of star clusters in each subregion. Black dots show the relative positions of young stars, and arrows show their residual tangential velocities after subtracting the mean motion of each cluster. Colors of subregions match Figure 2 (b). Black crosses mark the cluster centers (Table 5, Columns (3) and (4)). The lower-left corner of each panel shows the number of young stars in this analysis, the mean radial component of the relative velocities ﹩\overline{{v}_{r,k}}﹩, and its ratio to the corresponding dispersion ﹩\overline{{v}_{r,k}}/{\sigma }_{{v}_{r,k}}﹩.
Other Images in This Article
Show More
Copyright and Terms & Conditions
© 2026. The Author(s). Published by the American Astronomical Society.

Copyright ©
2026 Astronomy Image Explorer. All Rights Reserved.
