

Image Details
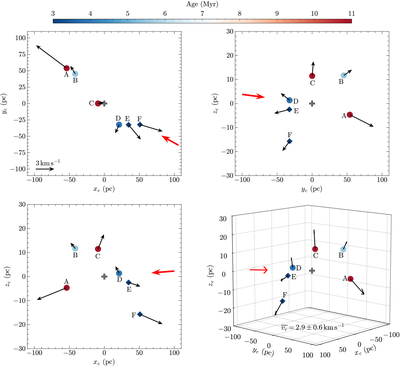
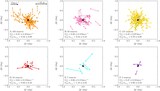
Caption: Figure 4.
3D distributions and motions of the subregions in the local Cartesian coordinate system centered on the reference center of S205 (defined in Section 3.1), with its axes aligned with those of the Heliocentric Galactic Cartesian coordinate system. The subregions are shown as circles and diamond symbols color coded by age, with relative motions shown as black arrows. The gray plus marks the reference center of S205. Line-of-sight directions are indicated by red arrows. The upper-left, upper-right, lower-left, and lower-right panels show the xc–yc, yc–zc, xc–zc projections, and the 3D view, respectively. The mean radial component of the 3D relative velocities is shown in the lower-right panel, with a positive value indicating expansion. The interactive version of the 3D view is available online.
An interactive version of this figure is available in the online article.
An interactive version of this figure is available.
An interactive version of this figure is available in the online journal.
Other Images in This Article
Show More
Copyright and Terms & Conditions
© 2026. The Author(s). Published by the American Astronomical Society.

