Image Details

Choose export citation format:

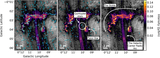
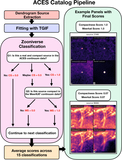
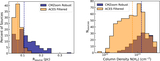
ACES. VII. Compact Continuum Source Catalog of the Central Molecular Zone

  • Authors: Jennifer Wallace, Cara Battersby, Nazar Budaiev, H Perry Hatchfield, Ashley T. Barnes, Taehwa Yoo, Miriam G. Santa-Maria, Antonio Daley, Q. Daniel Wang, Anika Schmiedeke, Kaitlyn E. Sheriff, Jairo Armijos-Abendaño, Daniel Walker, Gwenllian Williams, Dani R. Lipman, Farideh Mazoochi, Natalie O. Butterfield, Francisco Nogueras-Lara, Yoshiaki Sofue, Ralf S. Klessen, Simon C. O. Glover, Katharina Immer, Savannah R. Gramze, Katarzyna M. Dutkowska, Rojita Buddhacharya, Laura Colzi, Ashley Lieber, Alyssa Bulatek, Michael Wieber, Pablo García, Denise Riquelme-Vásquez, Xing Pan, Jens Kauffmann, Marc W. Pound, Enrico Di Teodoro, Thushara Pillai, Emad Alkhuja, Yue Hu, Dennis Perlot, Howard A. Smith, Victor M. Rivilla, Wenyu Jiao, Fengwei Xu, Jonathan D. Henshaw, Adam Ginsburg, Elisabeth A.C. Mills, Qizhou Zhang, Steven N. Longmore, Nguyen M. Khang, Galaxy Salo, Jakub Poznanski, Dylan Páre, Maya A. Petkova, Izaskun Jiménez-Serra, Xing Lu, Sergio Martín, Álvaro Sánchez-Monge, Bijas Najimudeen, Christoph Federrath, Tabassum S. Tanvir, Pei-Ying Hsieh, John Bally, Paul Ho, Mattia C. Sormani, Robin G. Tress, Jaime E. Pineda

Jennifer Wallace et al 2026 The Astrophysical Journal 1009 .

  • Provider: AAS Journals

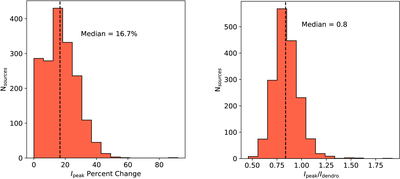
Caption: Figure B1.

Two histograms characterizing the difference in the initial peak intensity, Ipeak, of ACES sources extracted by the dendrogram and the corrected peak intensity calculated using TGIF. Both histograms are using the “full” version of the catalog. The left panel is a histogram of the percent change in Ipeak, and the right panel is a histogram of the Ipeak ratio. The dashed vertical lines indicate the median value for each distribution.

Other Images in This Article
Copyright and Terms & Conditions

Additional terms of reuse