

Image Details
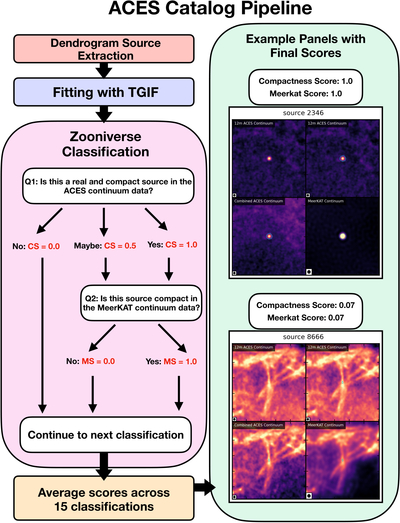
Caption: Figure 4.
The ACES catalog pipeline, including a decision tree for the Zooniverse source classification procedure outlining the questions presented to volunteers, the possible responses, and the compactness score and MeerKAT score corresponding to each response. In the final section of the flow chart (green box), we present two examples of the four-panel figures used for classification in the Zooniverse user interface. Each panel is centered on the coordinates of the source being classified. The top panels show the 12 m ACES continuum mosaic image, the bottom left panel shows the ACES mosaic combined with single-dish GBT observations, and the bottom right panel shows the MeerKAT 1.28 GHz continuum image. The top right and bottom panels include the dendrogram contour in cyan. The synthesized beam for each map is shown in the bottom left corner of each panel. The unique source ID is given at the top of the figure, corresponding to the “ACES ID” column of the catalog (Table 2).
Other Images in This Article
Copyright and Terms & Conditions
© 2026. The Author(s). Published by the American Astronomical Society.

