

Image Details
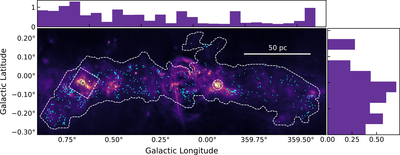
Caption: Figure 6.
The spatial distribution of source detections from the filtered version of the ACES compact continuum source catalog (cyan points) overlaid on the 12 m ACES 3 mm continuum mosaic combined with single-dish GBT observations. The white, dashed contours show the area of the CMZ that the ACES catalog covers. Sources found within the rectangular and circular regions are excluded from the catalog due to the impact of interferometric imaging artifacts. The marginal histograms depict the number density of sources per square arcminute along the Galactic longitude and latitude axes.
Other Images in This Article
Copyright and Terms & Conditions
© 2026. The Author(s). Published by the American Astronomical Society.

Copyright ©
2026 Astronomy Image Explorer. All Rights Reserved.
