

Image Details
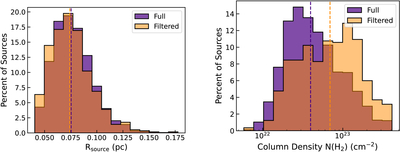
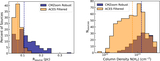
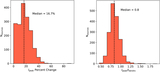
Caption: Figure C1.
Comparing the radius (left) and Herschel column density (right) distributions for detections in the filtered (orange) and full (purple) versions of the ACES compact continuum source catalog. The effective radius (Rsource) is calculated from the geometric mean of the FWHM axes of the fitted TGIF ellipses. The column density is the Herschel column density map value at the location of the peak pixel of the ACES source. The dashed lines show the median values of each distribution.
Other Images in This Article
Copyright and Terms & Conditions
© 2026. The Author(s). Published by the American Astronomical Society.

Copyright ©
2026 Astronomy Image Explorer. All Rights Reserved.
