

Image Details
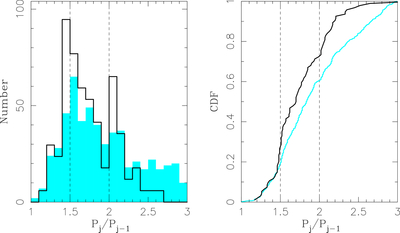
Caption: Figure 6.
The orbital period ratios of all Kepler planets (blue histogram and blue line) are compared to those of Kepler planets in systems with the gap complexity C < 0.1 and observed multiplicity mobs≥4 (black lines). Planets in the low gap-complexity systems are often found near the 3:2 and 2:1 mean-motion resonances (MMRs; vertical dashed lines). These systems contribute to the divergence between the model and observed gap complexities in Figure 4.
Other Images in This Article
Show More
Copyright and Terms & Conditions
© 2026. The Author(s). Published by the American Astronomical Society.

Copyright ©
2026 Astronomy Image Explorer. All Rights Reserved.
